
TL;DR: Hair density apps use your phone camera and AI to count hairs per square centimeter, measure follicle miniaturization, and produce a repeatable baseline you can compare month to month. Used correctly, with consistent lighting, camera distance, and scalp part location, they catch real change about 3 to 4 months before you'd notice it in the mirror.
What does a hair density app actually measure?
A hair density app does one core thing: it turns a photograph of your scalp into numbers. It estimates hair density (hairs per square centimeter), hair shaft diameter, and sometimes the ratio of terminal hairs (thick, pigmented) to vellus hairs (thin, wispy, miniaturizing). Some apps map those numbers onto a scalp diagram so you can see which zones are thinning fastest.
The underlying technology varies by app. The simplest tools count visible hair strands in a cropped photo region. More sophisticated ones use convolutional neural networks trained on trichoscopy images to classify individual follicular units. A 2021 study in Skin Research and Technology found that AI-assisted hair counting on smartphone images correlated with professional trichoscopy at r = 0.91 for density estimates in standardized lighting conditions [1].
Here's what apps do not measure: scalp health, sebum production, or the root cause of loss. They're measurement tools, not diagnostic tools. If your numbers are dropping, you still need a dermatologist to tell you why. Think of the app as a bathroom scale in a weight-loss program. Useful for tracking. Useless for explaining why the number moved.
Which hair density apps are worth using?
No consumer hair density app holds FDA clearance as of mid-2025. The FDA has cleared certain trichoscopy devices used in clinical settings, but over-the-counter apps sit in a different category [2]. Calibrate your trust accordingly.
The apps with the most independent data behind them tend to share a few traits: they prompt you to use a reference scale or fixed camera distance, they use a defined region of interest (ROI) rather than freeform photos, and they store longitudinal data so you can compare sessions.
| App / Tool | Platform | Core metric | Requires attachment? | Price |
|---|---|---|---|---|
| HairMetrics (clinical) | iOS/Android | Density, diameter | Optional dermatoscope | Subscription |
| Trichoscale Pro | iOS | Density, miniaturization ratio | No (clip lens helps) | Free + paid tiers |
| Manual trichoscopy photos | Any camera | Whatever your derm measures | Dermatoscope | Cost of derm visit |
| Nioxin Hair Profiler | iOS/Android | Thinning zone map | No | Free |
| HairCheck (clinical device) | Salon device | Bundle cross-section | Yes (salon unit) | Per session fee |
For home use, any app with a fixed-frame template and session history beats one that just lets you take a free-form selfie. A cheap clip-on dermatoscope lens (roughly $15 to $40 on Amazon) meaningfully improves image consistency and is worth the money if you're tracking seriously.
Want a baseline before you start a treatment like minoxidil for men or finasteride? Run three app sessions in the same week to establish your personal starting range before you touch any product.
How do you set up a session so the numbers are actually comparable?
Consistency kills noise. The single biggest reason people get contradictory readings month to month is that they changed something without realizing it: different lighting, different part location, different time of day, hair washed versus not.
Here is a repeatable protocol:
-
Always wash your hair and let it air dry fully (or blow dry on cool) before the session. Wet versus dry hair changes apparent density a lot.
-
Use the same light source every time. A daylight LED bulb directly overhead is ideal. Avoid windows: cloud cover changes color temperature and the app's contrast detection. Research on phototrichogram reproducibility names standardized lighting as the single largest source of inter-session variance [3].
-
Part the hair at the exact same location. Mark it. Take a photo of your part location the first time and compare every later session to that photo before you shoot.
-
Hold the phone (or clip-on lens) at the same distance. Most apps specify a distance, often 1 to 2 cm for dermatoscope-style capture. If yours doesn't, set a fixed distance using a piece of tape on your wrist or a homemade stand.
-
Take at least three photos per zone and let the app average them. Single-shot readings fluctuate.
-
Log the date, the hair product used that week, and any treatments ongoing. You'll want this context later.
The three zones worth tracking for androgenic alopecia are the frontal hairline (where recession starts), the vertex (crown), and the occipital zone as a control. The back of your head is genetically resistant to DHT [4], so it works as an internal reference. If your frontal density drops 15% while your occipital density holds steady, that pattern points to androgenic alopecia. If both drop equally, consider telogen effluvium or a systemic cause.
How often should you take measurements?
Monthly is the right cadence for most people. Hair grows roughly 1 to 1.5 cm per month, and meaningful density changes from treatment (or loss) build up over weeks, not days [5]. Checking every week produces noise and anxiety. Checking every six months means you've missed months of data that could tell you whether a treatment is working.
Just started a treatment like finasteride and minoxidil together? The first three months will often show a temporary shed, particularly with minoxidil. Your app numbers may go down before they go up. That's expected and well-documented. The American Academy of Dermatology notes that minoxidil users may experience increased shedding in the first 2 to 4 weeks [6]. Seeing that shed show up as a number drop in an app can be alarming if you don't know to expect it. Know to expect it.
A reasonable tracking schedule:
- Baseline: three sessions in week 1
- Month 1, 2, 3: monthly sessions
- Month 3 onwards: monthly, with a formal comparison against baseline every 6 months
The 6-month comparison is when you make real decisions: is this treatment doing enough, or do I need to talk to my derm about escalating?
What counts as a meaningful change vs. measurement noise?
This is where most people go wrong. They see a 3% drop in density and panic, or a 4% rise and declare victory. Neither reaction is earned.
Published phototrichogram research puts the coefficient of variation for repeated same-day measurements at around 5 to 8% even under controlled conditions [3]. That means a reading of 200 hairs/cm² could legitimately read as 184 to 216 on a different shot without anything actually changing. Your noise floor is roughly ±8%.
A change is probably real if:
- It exceeds 10% in a consistent direction across at least two consecutive monthly sessions.
- It appears in multiple zones at once (or in the expected zones for your loss pattern).
- It matches something you can see in the mirror or feel when styling.
A change is probably noise if:
- It reversed itself the following month.
- Only one zone changed while control zones shifted in the same direction.
- You changed your lighting or part location between sessions.
Clinical trials typically require a change of at least 10 to 15 hairs per cm² to call a treatment result significant [7]. That's a useful benchmark for home tracking too.
Can an app replace a professional trichoscopy exam?
No. And anyone who tells you otherwise is overselling the technology.
Professional trichoscopy uses a calibrated dermoscope at 20 to 70x magnification with polarized light. It can visualize perifollicular pigmentation, yellow dots (empty follicles), and the precise ratio of anagen to telogen hairs. A trained dermatologist or trichologist reading those images can diagnose alopecia areata, scarring alopecia, and other conditions that a consumer app cannot tell apart from plain androgenic alopecia [8].
What consumer apps are genuinely good at is giving you a longitudinal record to bring to that appointment. Show your dermatologist 12 months of density readings, and the conversation gets far more specific than "I think I've been losing hair." You can say which zones changed, by how much, and when it started. That context is worth a lot.
For anyone with a receding hairline that's actively moving, monthly app tracking plus an annual derm visit is a reasonable standard for self-monitoring.
Readings dropping fast, more than 15% over three months in the frontal zone? Don't wait for your annual appointment. That pace warrants a sooner look, because some causes (like certain scarring alopecias) cause permanent follicle loss if untreated. For more on what causes hair loss in the first place, understanding the underlying mechanism helps you read your own numbers.
How do you interpret density numbers in the context of Norwood stages?
Norwood stages describe hair loss patterns visually, not numerically. But density readings map onto them loosely.
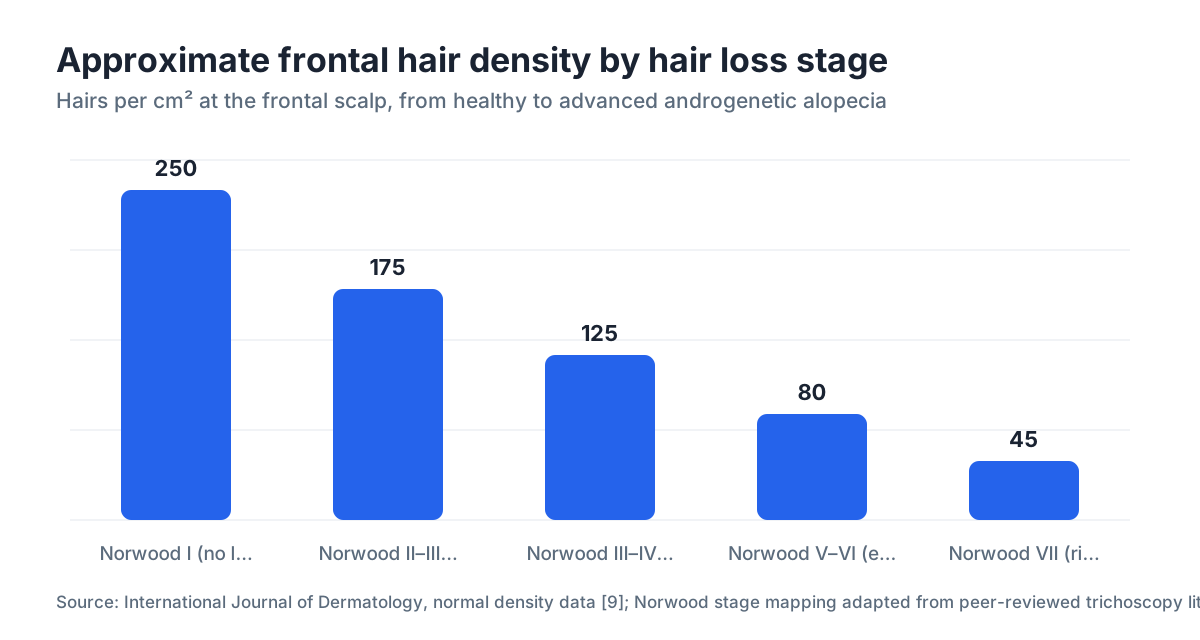
Research on healthy scalps finds average frontal density of roughly 180 to 300 hairs/cm² in people with no hair loss, with wide individual variation by ethnicity and age [9]. As androgenic alopecia moves through the Norwood stages, density in the affected zones drops, though the exact numbers swing widely between individuals.
| Norwood Stage | Approximate frontal density range | Clinical appearance |
|---|---|---|
| I (no loss) | 200 to 300 hairs/cm² | Full density, no recession |
| II, III | 150 to 200 hairs/cm² | Early recession, temples thinning |
| III, IV | 100 to 150 hairs/cm² | Visible thinning, mid-scalp involved |
| V, VI | 60 to 100 hairs/cm² | Extensive loss, bridging |
| VII | Under 60 hairs/cm² | Only rim of hair remains |
These are rough ranges, not diagnostic cutoffs. Your baseline matters more than the absolute number. Someone who naturally has 220 hairs/cm² and drops to 170 has lost roughly 23%, which is clinically significant. Someone who started at 165 and reads 160 has barely moved.
That's why establishing your personal baseline early, ideally before you see visible loss, is the most valuable thing an app can do for you. By the time a Norwood III pattern is visible in the mirror, you've often lost 50% or more of density in that zone [10].
How do apps track treatment response to minoxidil or finasteride?
This is arguably the most practical use of a hair density app. Clinical trials for both minoxidil and finasteride use hair count measurements as primary endpoints, so you're essentially running a personal version of the same methodology.
The five-year finasteride trial (Merck, published in the Journal of the American Academy of Dermatology) used standardized hair counts in a 1 cm² target area. After 12 months, mean hair count rose by 107 hairs in the finasteride group versus a loss of 34 hairs in the placebo group [7]. That scale of change, roughly 100+ hairs per cm² difference at one year, is what real treatment success looks like. If your app shows a 5-hair improvement after six months, temper your expectations.
For minoxidil, the FDA-approved labeling (for 5% topical) states that results are typically assessed at 4 months and that continued use is required to maintain any benefit [11]. Your app sessions at month 4 and month 8 are the two check-ins that matter most if you're using topical minoxidil.
For [oral minoxidil](/blog/oral minoxidil), the timeline is similar but the systemic exposure is different. Tracking both density and any side effects in your session notes (alongside your app readings) gives you a fuller picture. Read more on minoxidil side effects to know what to watch for beyond the numbers.
A practical rule: if your app shows no density improvement after six months of consistent treatment, that's a signal worth discussing with your doctor. Not a reason to quit on your own, but a reason to revisit the plan.
What lighting and camera settings produce the most accurate readings?
Most app failures come down to photography basics, not the algorithm.
Color temperature: aim for 5000 to 6500K (daylight). Warm incandescent light makes darker hair blend into scalp and underestimates density. Cool blue light creates harsh shadows that overestimate it. A cheap daylight bulb from a hardware store beats natural window light, which shifts all day.
Exposure: avoid overexposure. Blown-out highlights on the scalp wash out the contrast between hair and skin that the counting algorithm depends on. If your phone has manual controls, set exposure so the scalp reads as a light gray, not pure white.
Focus: tap the scalp to focus, not the hair. The hair shafts at 1 to 2 cm distance will be sharp enough, and scalp focus gives you better root-level visibility.
Hair color matters. Platinum blonde and white hair is genuinely harder to measure with consumer apps. Most AI counting models were trained mostly on brown and black hair trichoscopy datasets [1]. If you have very light hair, your readings may carry higher variance. A clip-on dermatoscope with its own LED ring light helps a lot in this case.
One more thing on dry shampoo and styling products: remove them before every session. They coat hair shafts and inflate diameter readings, which throws off miniaturization ratios.
Where does MyHairline's AI scan fit into this kind of tracking?
Want a structured starting point before you commit to a monthly tracking routine? MyHairline's free AI scan at myhairline.ai/scan gives you an immediate baseline analysis from a single photo. It maps your loss pattern, estimates your approximate Norwood stage, and flags which zones show early thinning. It's a good first step, not a replacement for the ongoing monthly protocol described above.
The real value of the scan is that it gives you a documented starting point with a date attached. Six months from now, when you're comparing your app readings, you'll have an external reference for where you were before you started any treatment. That context is genuinely useful.
What are the limits of hair density apps you should know before trusting them?
Apps are tools with real constraints. Being clear-eyed about them prevents bad decisions.
First, no consumer app has been validated in a large peer-reviewed RCT as a standalone diagnostic. The AI-trichoscopy correlation studies that exist (like the r = 0.91 paper cited earlier) ran under controlled clinic conditions, not bathroom selfie conditions [1].
Second, apps cannot tell types of hair loss apart. A density drop that looks identical in numbers could be androgenic alopecia, telogen effluvium, or early alopecia areata. The treatment for each is completely different. Numbers alone don't tell you which one you're dealing with.
Third, density counts miss fiber diameter. A scalp can hold its hair count while those hairs miniaturize from 70 microns to 30 microns in diameter, which is a significant clinical change [8]. Apps that measure only count miss this. Look for apps that report both count and caliber.
Fourth, the psychological hit is real. Checking density weekly, seeing normal measurement variance, and catastrophizing the fluctuations is a well-documented problem among people tracking hair loss. The protocol in this article, monthly, with awareness of the ±8% noise floor, exists specifically to reduce that. If tracking is making you more anxious rather than more informed, that's a sign to check in less often, not more.
Finally, there's the supplement and lifestyle noise problem. If you recently changed your diet, started hair loss supplements, had a stressful event, or changed medications, your density may swing for reasons completely unrelated to whatever treatment you're crediting or blaming. Keep a simple log. Without it, your data is uninterpretable.
When should tracking results prompt a doctor visit?
Track, but know your escalation triggers.
See a dermatologist if your app shows any of these patterns:
- Frontal or vertex density drops more than 15% over three consecutive months
- Diffuse loss across all zones including the occipital control zone
- Patchy density loss that doesn't follow a typical Norwood pattern
- Any zone reaches below 100 hairs/cm² for the first time
- Your trend is downward and you've already been on treatment for six months
For women specifically, diffuse density drop across the top of the scalp that spares the frontal hairline is the classic female-pattern presentation. That pattern looks very different numerically from male androgenic alopecia, and treatment options differ. The AAD recommends evaluation by a board-certified dermatologist for any woman experiencing noticeable hair thinning [6].
If your derm suggests a hair transplant based on your history, bring your app tracking data to that consultation. Surgeons assessing donor density and recipient zone planning benefit from knowing the trajectory of your loss, more than a single snapshot. More on that process at hair transplant.
And if you've been reading up on DHT's role in your loss pattern, understanding how DHT blockers work mechanically helps you set realistic expectations for what a density improvement actually looks like in practice.
Sources
- Skin Research and Technology, 2021, AI hair counting smartphone validation study
- U.S. FDA, Device Classification Database
- Journal of the European Academy of Dermatology and Venereology, Phototrichogram reproducibility
- National Library of Medicine / PubMed, Androgenetic alopecia review
- American Academy of Dermatology, Hair loss overview
- Journal of the American Academy of Dermatology, Finasteride 5-year trial (Merck)
- International Journal of Dermatology, Normal scalp hair density by ethnicity
- British Journal of Dermatology, Early androgenetic alopecia detection
- FDA, Minoxidil 5% topical solution prescribing information / OTC labeling